Keywords


 5'11", 32Mb
 4'17", 13Mb
  4'59", 18Mb
  2'52", 18Mb
 7'39", 55Mb

 3'01", 47Mb 3'01", 47Mb


 7'39", 55Mb
 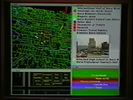 7'23", 186Mb
  4'22", 55Mb
  7'40", 111Mb

 5'12", 81Mb
  8'09", 138Mb
  2'01", 24Mb
  3'09", 20Mb

 7'36", 42Mb
  3'56", 15Mb
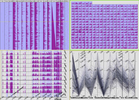

 57", 2Mb
  2'54", 13Mb
Temporal events, while often discrete, also have interesting relationships within and across times: larger events are often collections of smaller more discrete events (battles within wars; artists' works within a form); events at one point also have correlations with events at other points (a play written in one period is related to its performance over a period of time). Most temporal visualisations, however, only represent discrete data points or single data types along a single timeline: this event started here and ended there; this work was published at this time; this tag was popular for this period. In order to represent richer, faceted attributes of temporal events, we present Continuum. Continuum enables hierarchical relationships in temporal data to be represented and explored; it enables relationships between events across periods to be expressed, and in particular it enables user-determined control over the level of detail of any facet of interest so that the person using the system can determine a focus point, no matter the level of zoom over the temporal space. We present the factors motivating our approach, our evaluation and implementation of this new visualisation which makes it easy for anyone to apply this interface to rich, large-scale datasets with temporal data.
7'36", 42Mb 7'39", 55Mb  7'08", 19Mb
 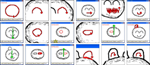 4'35", 31Mb
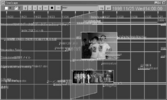
 A history-of-user-operations function helps make applications easier to use. For example, users may have access to an operation history list in an application to undo or redo a past operation. To provide an overview of a long operation history and help users find target interactions or application states quickly, visual representations of operation history have been proposed. However, most previous systems are tightly integrated with target applications and difficult to apply to new applications. We propose an application-independent method that can visualize the operation history of arbitrary GUI applications by monitoring the input and output GUI events from outside of the target application. We implemented a prototype system that visualizes operation sequences of generic Java Awt/Swing applications using an annotated comic strip metaphor. We tested the system with various applications and present results from a user study.


 3'53", 52Mb

 7'15", 52Mb


Asynchronous collaborators often use freeform ink annotations to point to visually salient perceptual features of line charts such as peaks or humps, valleys, rising slopes and declining slopes. We present a set of techniques for interpreting such annotations to algorithmically identify the corresponding perceptual parts. Our approach is to first apply a parts-based segmentation algorithm that identifies the visually salient perceptual parts in the chart. Our system then analyzes the freeform annotations to infer the corresponding peaks, valleys or sloping segments. Once the system has identified the perceptual parts it can highlight them to draw further attention and reduce ambiguity of interpretation in asynchronous collaborative discussions.